istioctl是当前官方推荐的安装方式,相比helm有更好的体验,但实践过程中也遇到些问题,在此对1.5.0版本的使用做个整理。
包括默认安装、可观察性组件、外部Chart等自定义安装。
目标
- 安装 Istio 环境
- 部署 httpbin 用例
- Prometheus、Grafana和Kiali组件
环境
- minikube version: v1.7.2
- kubernetes version: v1.16.7
istioctl
参考官方文档下载或者到Github选择平台下载,
然后将bin目录加入 path 环境变量。
检验
istioctl version
2020-03-21T10:21:14.012409Z	warn	will use `--remote=false` to retrieve version info due to `no Istio pods in namespace "istio-system"`
1.5.0
Istio 默认安装
默认安装很简单,只需要一个manifest apply命令
istioctl manifest apply
This will install the default Istio profile into the cluster. Proceed? (y/N) y
Detected that your cluster does not support third party JWT authentication. Falling back to less secure first party JWT. See https://istio.io/docs/ops/best-practices/security/#configure-third-party-service-account-tokens for details.
- Applying manifest for component Base...
✔ Finished applying manifest for component Base.
- Applying manifest for component Pilot...
✔ Finished applying manifest for component Pilot.
  Waiting for resources to become ready...
  Waiting for resources to become ready...
- Applying manifest for component IngressGateways...
- Applying manifest for component AddonComponents...
✔ Finished applying manifest for component AddonComponents.
✔ Finished applying manifest for component IngressGateways.

✔ Installation complete
如果安装过程遇到镜像无法下载导致失败,可以使用
--set设置替换镜像,默认安装涉及两个镜像源配置:
- istio相关镜像:
--set hub=dockerhub.azk8s.cn/istio- prometheus镜像:
--set values.prometheus.hub=dockerhub.azk8s.cn/promistioctl manifest apply \ --set hub=dockerhub.azk8s.cn/istio \ --set values.prometheus.hub=dockerhub.azk8s.cn/prom
检验Pod,只有三个运行实例
kubectl get po -n istio-system
    NAME                                    READY   STATUS    RESTARTS   AGE
    istio-ingressgateway-78f757846c-7sqg7   1/1     Running   0          69s
    istiod-65c5b8df9d-qglhr                 1/1     Running   0          87s
    prometheus-6fd77b7876-dk4xq             2/2     Running   0          67s
检验Service,注意istio-ingressgateway暴露的端口,后面prometheus、grafana和kiali的gateway会用到
$ kubectl get svc -n istio-system
    NAME                   TYPE           CLUSTER-IP       EXTERNAL-IP   PORT(S)                                                                                                                      AGE
    istio-ingressgateway   LoadBalancer   10.100.77.12     <pending>     15020:31791/TCP,80:31302/TCP,443:31151/TCP,15029:31679/TCP,15030:31818/TCP,15031:31327/TCP,15032:30470/TCP,15443:31898/TCP   101s
    istio-pilot            ClusterIP      10.98.216.5      <none>        15010/TCP,15011/TCP,15012/TCP,8080/TCP,15014/TCP,443/TCP                                                                     2m3s
    istiod                 ClusterIP      10.109.224.120   <none>        15012/TCP,443/TCP                                                                                                            2m2s
    prometheus             ClusterIP      10.105.60.208    <none>        9090/TCP
这时测试网关80端口映射的31302会得到404,因为我们还没有任何服务,INGRESS_HOST参考官方文档根据环境获取,
curl -I  http://{INGRESS_HOST}:31302
    HTTP/1.1 404 Not Found
部署httpbin
首先为namespace添加istio-injection=enabled标签,开启自动注入sidecar
kubectl label namespace default istio-injection=enabled
部署httpbin服务以及网关
cd {istio-1.5.0_path}
kubectl apply -f samples/httpbin/httpbin.yaml -f samples/httpbin/httpbin-gateway.yaml
检验
kubectl get po -n default
    NAME                       READY   STATUS    RESTARTS   AGE
    httpbin-779c54bf49-dgcs4   2/2     Running   0          39s

kubectl get gateway -n default
    NAME              AGE
    httpbin-gateway   2m1s
测试服务
curl -I  http://192.168.39.130:31302
    HTTP/1.1 200 OK

curl http://192.168.39.130:31302/get
    {...}
可观察性组件
Istio的一大特点可观察性,主要由Prometheus、Grafana、Kiali和Tracing,其中Prometheus是默认安装组件。
前面在安装后检验Service时有提到istio-ingressgateway暴露的端口,其中有四个端口分别对应这4个服务:
| 端口 | 映射 | 服务 |
|---|---|---|
| 15029 | 31679 | kiali |
| 15030 | 31818 | prometheus |
| 15031 | 31327 | grafana |
| 15032 | 30470 | tracing |
虽然端口已经暴露,但每个服务对应的gateway需要自定义开启,配置路径为values.gateways.istio-ingressgateway.telemetry_addon_gateways.xxx_gateway,
对应yaml为gateways/istio-ingress/templates/addongateway.yaml,配置间istio-ingress的values。
在addongateway.yaml模板中都默认为https,如果测试不方便需要自己手动修改gateway,也可以参考后面的#外部Chart进行自定义安装。
Prometheus
Prometheus默认是安装,所以只需要启用gateway即可
istioctl manifest apply \
--set values.gateways.istio-ingressgateway.telemetry_addon_gateways.prometheus_gateway.enabled=true
Gateway改为HTTP服务
kubectl apply -f - <<EOF
apiVersion: networking.istio.io/v1alpha3
kind: Gateway
metadata:
  name: istio-prometheus-gateway
  namespace: istio-system
  labels:
    app: prometheus
    release: istio
spec:
  selector:
    istio: ingressgateway
  servers:
    - port:
        number: 15030
        name: https-prometheus
        protocol: HTTP
      hosts:
        - "*"
EOF
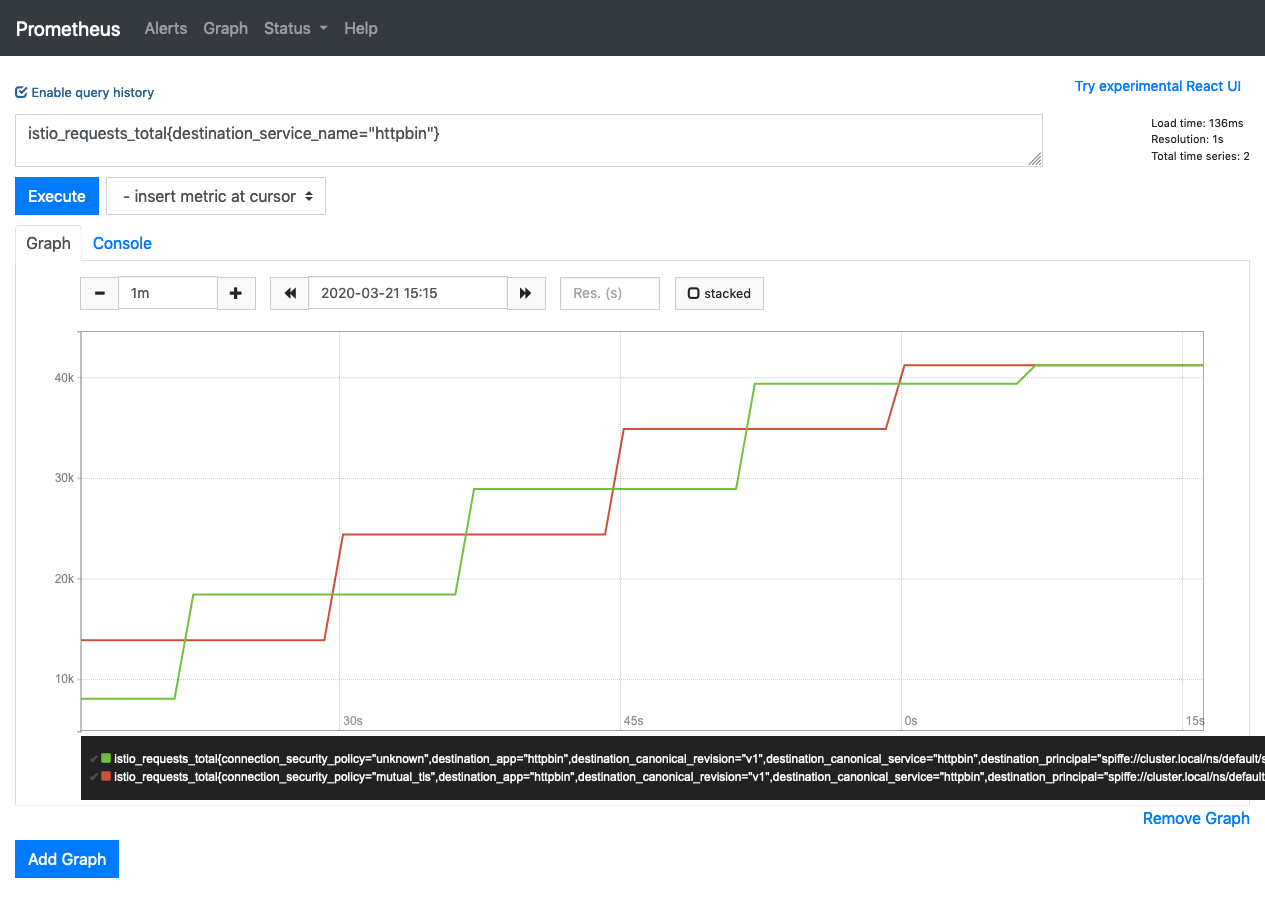
访问 http://{INGRESS_HOST}:31818 即可进入Prometheus的Web页面,先为httpbin灌入一些流量然后看Prometheus数据情况
hey -z 60s -c 2 http://{INGRESS_HOST}:31302/get
Grafana & Kiali & Tracing
这三个服务默认是不启动的,所以需要手动设置enabled,其中kiali需要增加一个createDemoSecret=true的配置,使用默认用户名(admin)和密码(admin)创建密钥,否则会有异常:
The Kiali secret is missing. Users are prohibited from accessing Kiali until an administrator creates a valid secret. Please refer to the Kiali documentation for more details.
istioctl manifest apply \
--set values.gateways.istio-ingressgateway.telemetry_addon_gateways.prometheus_gateway.enabled=true \
--set addonComponents.grafana.enabled=true \
--set values.gateways.istio-ingressgateway.telemetry_addon_gateways.grafana_gateway.enabled=true \
--set addonComponents.kiali.enabled=true \
--set values.kiali.createDemoSecret=true \
--set values.gateways.istio-ingressgateway.telemetry_addon_gateways.kiali_gateway.enabled=true \
--set addonComponents.tracing.enabled=true \
--set values.gateways.istio-ingressgateway.telemetry_addon_gateways.tracing_gateway.enabled=true
同样将gateway改为http
kubectl apply -f - <<EOF
apiVersion: networking.istio.io/v1alpha3
kind: Gateway
metadata:
  name: istio-prometheus-gateway
  namespace: istio-system
  labels:
    app: prometheus
    release: istio
spec:
  selector:
    istio: ingressgateway
  servers:
    - port:
        number: 15030
        name: https-prometheus
        protocol: HTTP
      hosts:
        - "*"
---
apiVersion: networking.istio.io/v1alpha3
kind: Gateway
metadata:
  name: istio-grafana-gateway
  namespace: istio-system
  labels:
    app: grafana
    release: istio
spec:
  selector:
    istio: ingressgateway
  servers:
    - port:
        number: 15031
        name: https-grafana
        protocol: HTTP
      hosts:
        - "*"
---
apiVersion: networking.istio.io/v1alpha3
kind: Gateway
metadata:
  name: istio-kiali-gateway
  namespace: istio-system
  labels:
    app: kiali
    release: istio
spec:
  selector:
    istio: ingressgateway
  servers:
    - port:
        number: 15029
        name: https-kiali
        protocol: HTTP
      hosts:
        - "*"
---
apiVersion: networking.istio.io/v1alpha3
kind: Gateway
metadata:
  name: istio-tracing-gateway
  namespace: istio-system
  labels:
    app: tracing
    release: istio
spec:
  selector:
    istio: ingressgateway
  servers:
    - port:
        number: 15032
        name: https-tracing
        protocol: HTTP
      hosts:
        - "*"
EOF
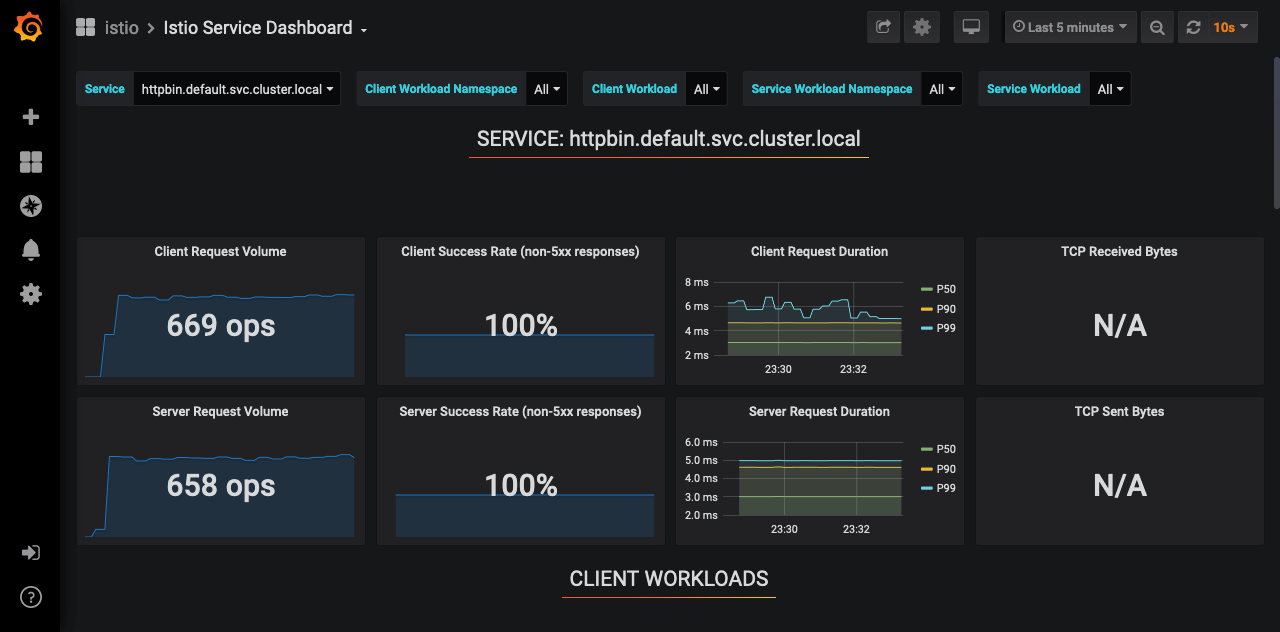
现在再次给httpbin灌入流量查看各个服务的效果
hey -z 300s -c 2 http://{INGRESS_HOST}:31302/get
Grafana
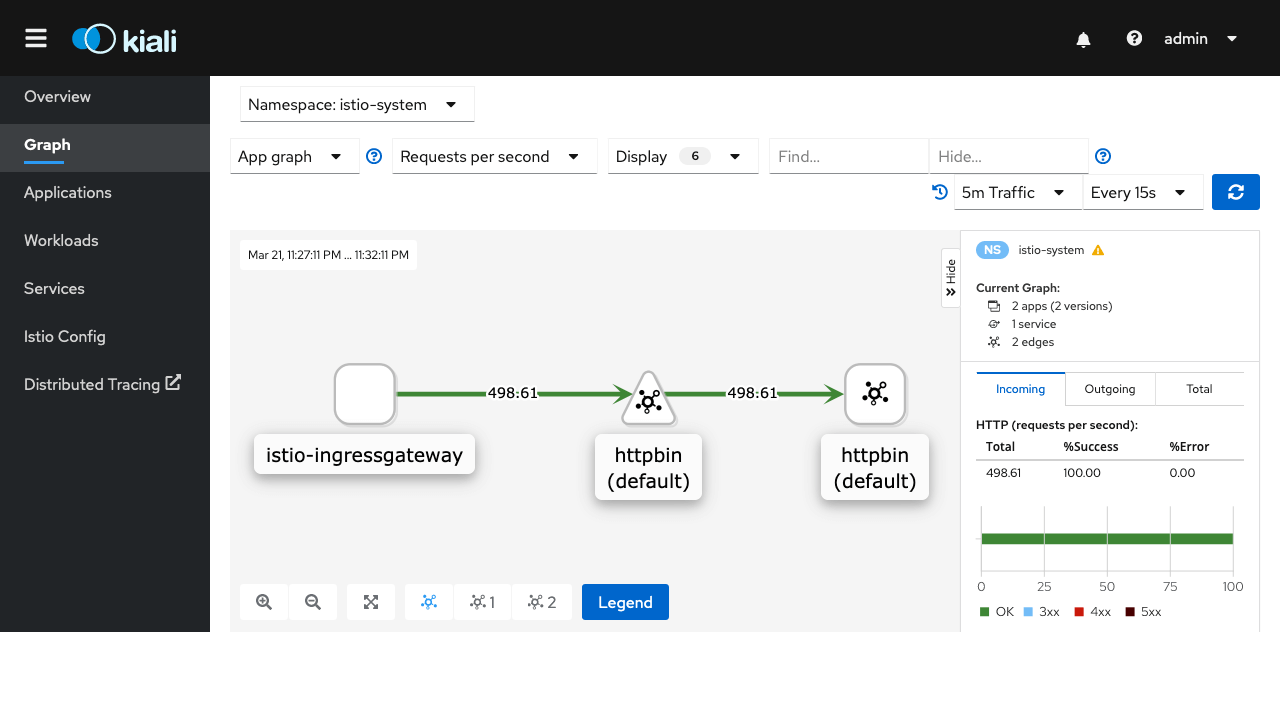
Kiali
Tracing

外部Chart-坑
官方文档有关使用外部Chart的部分存在问题,installPackagePath无效,需要用install_package_path替换,同时需要指定profile,应该也是istio实现BUG,
文档修改和BUG修复的PR istio/istio.io#6939 和 istio/istio#22371
release-1.5 最新版本已经修复此问题(文档更新PR istio/istio.io#6939未被采纳),所以如果
istioctl使用的是1.5.0的Release版本此问题仍然存在,在使用这一部分文档(install-from-external-charts)时需要要注意
addongateway.yaml的Gateway改为HTTP
# Template for telemetry addon gateways
{{ $gateway := index .Values "gateways" "istio-ingressgateway" }}
{{ range $addon := $gateway.telemetry_addon_gateways }}
{{ if $addon.enabled }}
apiVersion: networking.istio.io/v1alpha3
kind: Gateway
metadata:
  name: istio-{{ $addon.name }}-gateway
  namespace: {{ $.Release.Namespace }}
  labels:
    app: {{ $addon.name }}
    release: {{ $.Release.Name }}
spec:
  selector:
    istio: ingressgateway
  servers:
{{- if $addon.tls }}
    - port:
        number: {{ $addon.port }}
        name: https-{{ $addon.name }}
        protocol: HTTPS
      tls:
        mode: SIMPLE
        serverCertificate: /etc/istio/ingressgateway-certs/tls.crt
        privateKey: /etc/istio/ingressgateway-certs/tls.key
      hosts:
        - "*"
  {{- else }}
    - port:
        number: {{ $addon.port }}
        name: http-{{ $addon.name }}
        protocol: HTTP
        hosts:
          - "*"
{{- end }}
---
apiVersion: networking.istio.io/v1alpha3
kind: VirtualService
metadata:
  name: {{ $addon.name }}-virtual-service
  namespace: {{ $.Release.Namespace }}
  labels:
    app: {{ $addon.name }}
    release: {{ $.Release.Name }}
spec:
  hosts:
    - "*"
  gateways:
    - istio-{{ $addon.name }}-gateway
  http:
    - match:
        - port: {{ $addon.port }}
      route:
        - destination:
            host: {{ $addon.name }}.{{ $.Release.Namespace }}.svc.{{ $.Values.global.proxy.clusterDomain }}
            port:
              number: {{ $addon.desPort }}
---
apiVersion: networking.istio.io/v1alpha3
kind: DestinationRule
metadata:
  name: {{ $addon.name }}
  namespace: {{ $.Release.Namespace }}
  labels:
    app: {{ $addon.name }}
    release: {{ $.Release.Name }}
spec:
  host: {{ $addon.name }}.{{ $.Release.Namespace }}.svc.{{ $.Values.global.proxy.clusterDomain }}
  trafficPolicy:
    tls:
      mode: DISABLE
---
{{- end }}
{{- end }}
指定外部Chart部署
istioctl manifest apply \
--set profile=$PWD/install/kubernetes/operator/profiles/default.yaml \
--set install_package_path=$PWD/install/kubernetes/operator/charts \
--set values.gateways.istio-ingressgateway.telemetry_addon_gateways.prometheus_gateway.enabled=true \
--set addonComponents.grafana.enabled=true \
--set values.gateways.istio-ingressgateway.telemetry_addon_gateways.grafana_gateway.enabled=true \
--set addonComponents.kiali.enabled=true \
--set values.kiali.createDemoSecret=true \
--set values.gateways.istio-ingressgateway.telemetry_addon_gateways.kiali_gateway.enabled=true \
--set addonComponents.tracing.enabled=true \
--set values.gateways.istio-ingressgateway.telemetry_addon_gateways.tracing_gateway.enabled=true
使用--set过于麻烦可以使用yaml文件进行配置,profile和install_package_path的路径以istio的下载路径为例
$ vi profile.yaml

apiVersion: install.istio.io/v1alpha1
kind: IstioOperator
metadata:
  namespace: istio-system
  name: istio-operator
spec:
  profile: {istio-path}/install/kubernetes/operator/profiles/default.yaml
  install_package_path: {istio-path}/install/kubernetes/operator/charts

  addonComponents:
    prometheus:
      enabled: true
    kiali:
      enabled: true
    grafana:
      enabled: true
    tracing:
      enabled: true

  values:
    gateways:
      istio-ingressgateway:
        telemetry_addon_gateways:
          prometheus_gateway:
            enabled: true
          grafana_gateway:
            enabled: true
          kiali_gateway:
            enabled: true
          tracing_gateway:
            enabled: true
    kiali:
      createDemoSecret: true
istioctl manifest apply \
-f profile.yaml
有关自定义安装的chart、profile在hb-chen/istio-operator有些示例可以参考。